------------------------------------------------------------------------------------------------------------------
https://accounts.binance.com/register?ref=21391362 <- Get Discount on Binance Futures Fees With Referral Code
Referral Code : 21391362
------------------------------------------------------------------------------------------------------------------
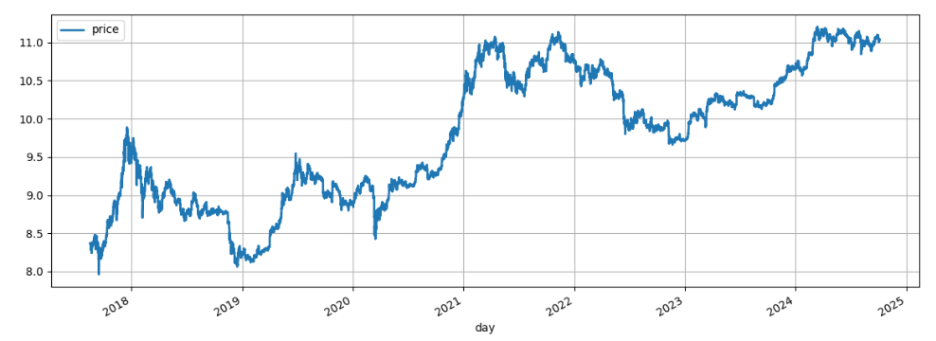
When predicting stock prices using machine learning, time series analysis is often used. There are many models, but let's use Arima to analyze time series. We will analyze Binance data from August 2017 to October 2024 based on 4-hour candles.
- Price and Volume Analysis
Get candle information using the historical_klines function.

Since the volume size is much larger than the market price, the market price will not be visible if it is printed as is. Divide the volume by 10 to make the market price size and volume size similar.

We can see that the trading volume was the highest in late 2022 ~ early 2023, which was the period when people lost interest due to the large drop in Bitcoin. We can guess that this was the time when the powers that be were accumulating.

ill the rate of return be higher when 1 won rises to 10 won? Will the rate of return be higher when 1,000 won rises to 2,000 won? Common sense tells us that the amount of increase is more important than the price. So let's convert the price to a logarithm and see when the rate of return was higher.

We can see that it is highest from mid-2020 to mid-2021 and then the rate of increase gradually decreases.
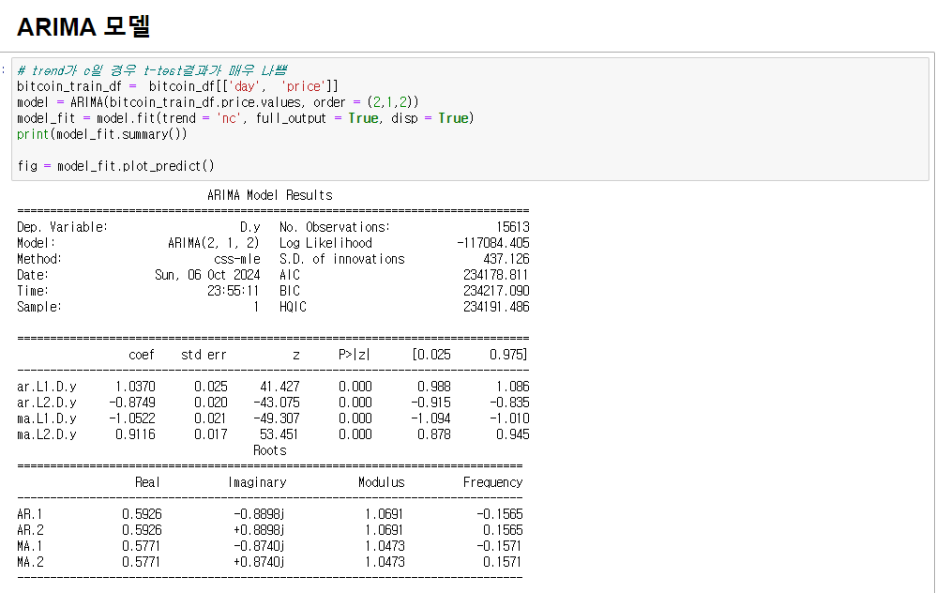
2. ARIMA model
Since the p-value is less than 0.05, we can conclude that the coefficients are statistically significant.
|
ar.L1.D.y
|
This means that the Bitcoin price in the past stage 1 has a positive effect on the current price.
|
|
ar.L2.D.y
|
t means that the past two-stage price has a negative impact on the current price.
|
|
ma.L1.D.y
|
t means that the error in the past step 1 has a negative effect on the current price.
|
|
ma.L2.D.y
|
The coefficient for the second moving average is 0.911, meaning it has a positive effect.
|
This is a model that predicts 200 days. (It is only a prediction through time series analysis, and will never lead to the corresponding results.)

The components function can be used to find out which time zones have the highest volatility.

You can see that volatility is highest on Tuesdays and Thursdays at midnight.


------------------------------------------------------------------------------------------------------------------
https://accounts.binance.com/register?ref=21391362 <- Get Discount on Binance Futures Fees With Referral Code
Referral Code : 21391362
------------------------------------------------------------------------------------------------------------------


