------------------------------------------------------------------------------------------------------------------
https://accounts.binance.com/register?ref=21391362 <- Get Discount on Binance Futures Fees With Referral Code
Referral Code : 21391362
------------------------------------------------------------------------------------------------------------------
When analyzing charts such as stocks or coins, it is essential to analyze previous data. Based on previous data, it finds a similar shape and decides to buy or sell. So, we will draw the most basic trading graph. We will use pandas, numpy, and jupter-lab for data analysis. Since pandas and numpy methods are data analysis methods, I won't explain them separately.
Get the previous data using the get_historical_klines_generator method studied previously and save it as a csv file. It is based on a 4-hour clock.
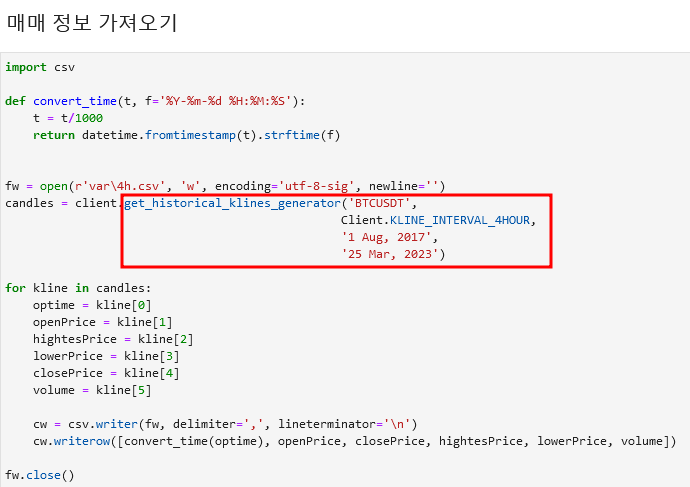
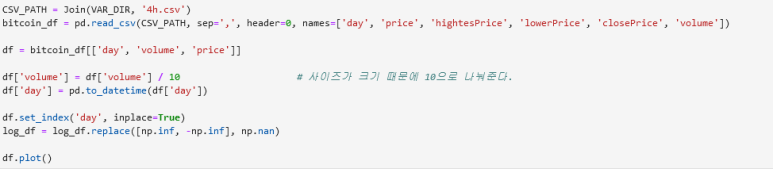
The historical_klines method has a lot of data, and we will output three important data: date, price, and transaction volume. The volume is divided by 10 because it is large.
Here is the result.
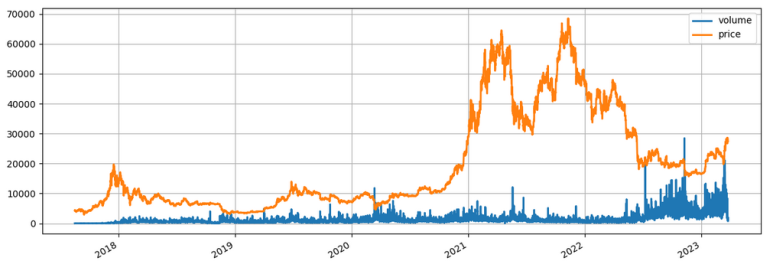
It is a weekly bar chart, and you can confirm that it is similar.
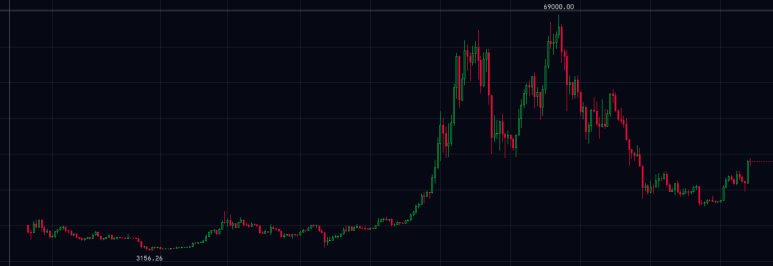
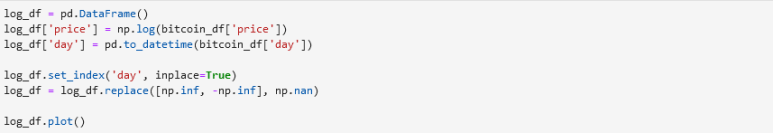
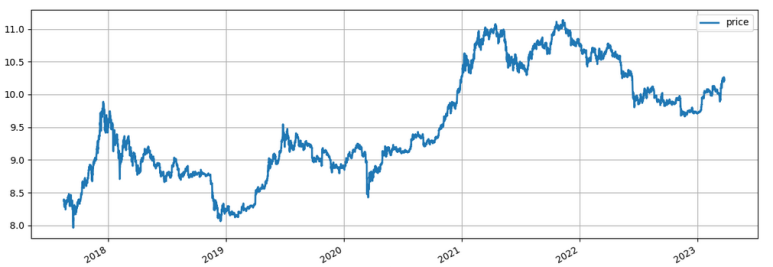
Let's print a log graph to output more accurate data.
------------------------------------------------------------------------------------------------------------------
https://accounts.binance.com/register?ref=21391362 <- Get Discount on Binance Futures Fees With Referral Code
Referral Code : 21391362
------------------------------------------------------------------------------------------------------------------


