[Bitcoin Automated Trading] Calculating and programming the RSI
------------------------------------------------------------------------------------------------------------------
https://accounts.binance.com/register?ref=21391362 <- Get Discount on Binance Futures Fees With Referral Code
Referral Code : 21391362
------------------------------------------------------------------------------------------------------------------
The Relative Strength Index (RSI) is a technical indicator that analyzes the price movement of a stock. The RSI is used to identify overbought and oversold conditions by measuring the relative strength of the rise and fall of the closing price.
Here's how to calculate RSI. Calculate the rise and fall over a period of time. In this case, the period is usually set to 14 days. Calculate the average value of the rise width. This is called Relative Strength (RS). Calculate the average value of the drop width. Calculate RSI by dividing RS by the average of the rises, adding to 1, then dividing by 100.
The formula for the above calculation process is as follows.
U: the average value of the rise over a period of time
D: the average value of the decline over a period of time
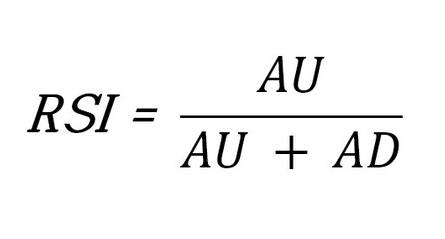
RS = U/D
RSI = 100 - (100 / (1 + RS))
For example, if the closing price for 14 days is as follows, the rise (U) and fall (D) for a certain period are calculated as follows.
※ closing price (100, 105, 110, 107, 109, 105, 103, 106, 102, 98, 95, 100, 98, 101)
U = (100+5+0+0+2+0+0+3+0+0+0+5+0+3)/14 = 18/14 = 1.29
D = (0+0+3+0+0+2+2+0+4+2+3+0+2+0)/14 = 18/14 = 1.29
Therefore, RS = U/D = 1.29/1.29 = 1, and RSI = 100 - (100/(1+RS)) = 50.
Let's code RSI in Python. We will develop it based on the EMA and the default 14 days.
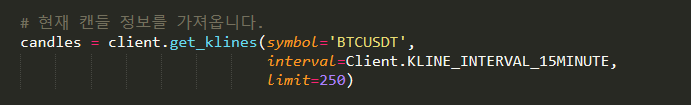
Get 14 15-minute period data by calling the get_klines method.

You can get the SMA by calling rolling and the EMA by calling ewm.

result.

However, you can see that the result value is different from the RSI value of TradingView. The above formula is the RSI developed by Wells Wilder. More detailed information can be found on the website below.
https://school.stockcharts.com/doku.php?id=technical_indicators:relative_strength_index_rsi

The important thing here is that you need 250 data. If you import 250 candlestick information from Binance and put it in, you can get an RSI value that almost matches TradingView.
full source code
------------------------------------------------------------------------------------------------------------------
https://accounts.binance.com/register?ref=21391362 <- Get Discount on Binance Futures Fees With Referral Code
Referral Code : 21391362
------------------------------------------------------------------------------------------------------------------